Subjective Wellbeing
Interest in subjective wellbeing has risen in recent years, both in academic research and government initiatives. In many countries, happiness has become an objective of public policy (Helliwell et al 2022). Subjective wellbeing encompasses different aspects: cognitive evaluation of one’s life, happiness, satisfaction, positive emotions such as joy and pride, and negative emotions such as pain and worry (Stiglitz et al 2009). Despite measurement challenges, subjective measures nevertheless provide important information about wellbeing and several questions have been included in large-scale surveys such as MICS6 and are thus considered in this report.
Persons with disabilities and disability more broadly have been largely absent in this growing international subjective wellbeing literature and discourse (Sunderland et al 2009). There is, however, a literature considering whether persons with disabilities have lower levels of subjective wellbeing. Some studies report similar levels of life satisfaction (Schulz and Decker 1985) but more studies show lower levels of subjective wellbeing (e.g. Hsieh and Waite 2019; van Campen and Cardol (2009); Oswald and Powdthavee 2008). Recently, studies in Iraq and Sierra Leone which used MICS6 find that having a functional difficulty is associated with lower life satisfaction, perception of a better life, and happiness (Pengpid and Peltzer 2019, 2020).
This report estimates three subjective wellbeing indicators by functional difficulty status using MICS6 for 25 countries. We start with a happiness indicator that is the share of women who report being very happy or somewhat happy. To assist respondents in answering the question on happiness, they were shown a card with smiling faces (and not so smiling faces) that correspond to the response categories ‘very happy’, ‘somewhat happy’, ‘neither happy nor unhappy’, ‘somewhat unhappy’ and ‘very unhappy’. Second, we use an optimism or perception of a better life indicator that is the share of women who report their life has improved during the last one year and that they expect that their life will be better after one year. Third, MICS uses a visual ladder-of-life scale, with explicit reference points (10, for the best possible life, and 0 for the worst possible life) and respondents are asked on which step of the ladder they feel they stand at this time. The visual aids used for the happiness question and the ladder of life measure maybe inaccessible to persons with seeing difficulties and thus introduce some bias in answer patterns based on functional difficulty types.
A. Results
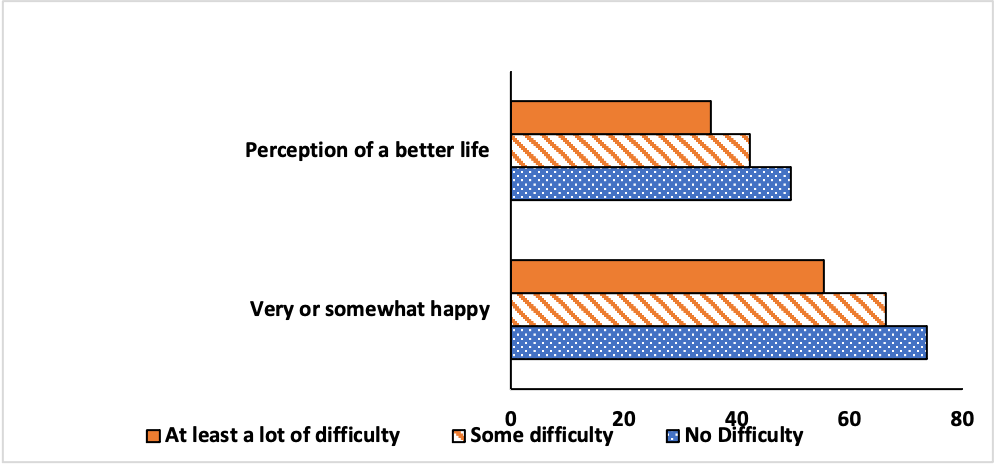
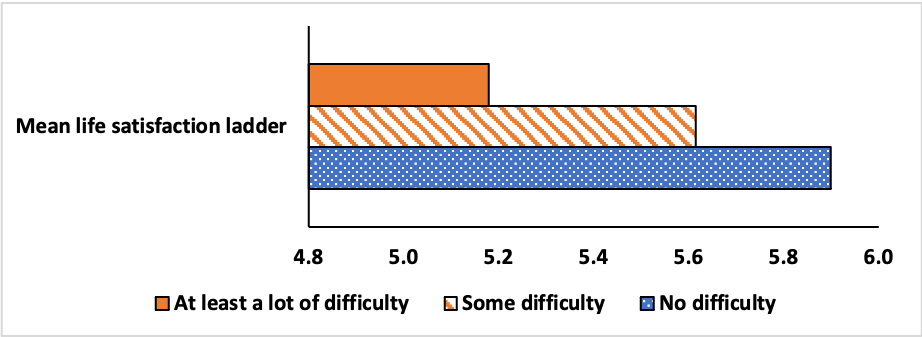
Results are available in the Subjective Wellbeing Tables ( 2022 results table). Cross-country estimates for the happiness and perception of a better life indicators are in Figure 11.1 and those for the mean life satisfaction ladder score are in Figure 11.2. Women with functional difficulties have significantly lower average levels of reported wellbeing than women with no functional difficulties for all three measures of subjective wellbeing. We also find a gradient: women with some difficulty report lower subjective wellbeing than women with no difficulty but higher wellbeing than women with at least a lot of difficulty. As shown in Table 11.1, wellbeing reported on the ladder is, on average, higher among women in urban areas and in the younger age group. Results do not differ across functional domains.
Figure 11.1: Cross-country estimates for happiness and optimism among women (%)
Source: Authors’ calculations based on MICS6 data for 25 countries.
Figure 11.2: Cross-country estimates for mean life satisfaction ladder (0 to 10)
Source: Authors’ calculations based on MICS6 data for 25 countries.
Table 11.1: Mean score on the life satisfaction ladder among women (0 to 10 scale)
| Sample | No Difficulty | Some difficulty | At least a lot of difficulty | Any difficulty |
|---|---|---|---|---|
| All women | 6.0 | 5.6 | 5.2 | 5.6 |
| Rural | 5.8 | 5.3 | 4.9 | 5.3 |
| Urban | 6.1 | 5.9 | 5.5 | 5.9 |
| Age 18-29 | 6.0 | 5.7 | 5.2 | 5.7 |
| Age 30 to 49 | 5.8 | 5.5 | 5.1 | 5.5 |
| With seeing difficulties | – | – | – | 5.1 |
| With hearing difficulties | – | – | – | 4.8 |
| With walking difficulties | – | – | – | 5.0 |
| With cognitive difficulties | – | – | – | 5.0 |
| With selfcare difficulties | – | – | – | 4.9 |
| With communication difficulties | – | – | – | 5.8 |
Source: Authors’ calculations based on MICS6 data for 25 countries.
Note: ‘-‘ refers to not applicable for ‘No difficulty’ and not available for ‘Some difficulty’ and ‘At least a lot of difficulty’ due to small sample sizes in many countries
Results are consistent across countries (Subjective Wellbeing Tables (add link). In each of the 25 countries, having any functional difficulty is significantly associated with a lower mean score and a lower share of women very happy or somewhat happy. For the share of women who report their life improved and will be better, that is the case for 23 out of 25 countries[20]. There is a gradient for the three subjective wellbeing indicators with a declining rate or declining scores found from no difficulty, some difficulty and at least a lot of difficulty. There are three exceptions with no gradient found: Central African Republic, Kiribati, and Malawi. This is illustrated in Figure 11.3.
Figure 11.3: Mean score on the life satisfaction ladder among women (0 to 10 scale)
Source: Authors’ calculations based on MICS6 data.
B. Discussion
To our knowledge, this report provides a first look into differences in wellbeing across functional difficulty status across countries. We find consistent patterns, with women with functional difficulties reporting, on average, lower levels of subjective wellbeing than women with no functional difficulties. This trend holds for different measures of subjective wellbeing and disaggregation methods and across rural and urban areas, younger, and middle-aged women.
The results could be due to two reasons: first, having a functional difficulty might directly affect women’s subjective wellbeing. At the same time, there may be a range of mediators linking functional difficulties and subjective wellbeing, such as barriers to educational, work, and social opportunities. Discrimination, and more broadly insecurity may also contribute to this relationship, which needs to be investigated further. More research is needed to understand the effects of environmental and policy conditions on subjective wellbeing.
Collecting data on functional difficulties using the WG-SS is key to make progress in the field of subjective wellbeing in both longitudinal and cross-sectional datasets. For instance, the World Gallup Poll is a major regular source of data on subjective wellbeing in over 150 countries. It uses fresh annual samples of 1,000 respondents aged 15 and older. Given an average disability prevalence rate of 15% among adults worldwide (WHO-World Bank 2011), it may provide enough of a sample size annually to track the subjective wellbeing of persons with disabilities. This seems particularly important as disability rights policies evolve worldwide (World Policy Analysis Center 2022) and such policy changes may impact subjective wellbeing.
Collecting data on functional difficulties using the WG-SS is key to make progress in the field of subjective wellbeing in both longitudinal and cross-sectional datasets. For instance, the World Gallup Poll is a major regular source of data on subjective wellbeing in over 150 countries. It uses fresh annual samples of 1,000 respondents aged 15 and older. Given an average disability prevalence rate of 15% among adults worldwide (WHO-World Bank 2011), it may provide enough of a sample size annually to track the subjective wellbeing of persons with disabilities. This seems particularly important as disability rights policies evolve worldwide (World Policy Analysis Center 2022) and such policy changes may impact subjective wellbeing.
[20]Exceptions are Lesotho and Montenegro.
 Go Back
