Multidimensional Poverty
Poverty is understood multidimensionally as it can take various forms (e.g. poor living conditions, low educational attainment). It can be measured by counting the number of deprivations experienced by an individual or a household (Alkire and Foster 2011). We identify multidimensional poverty by highlighting the share of women with more than one deprivation among three dimensions of wellbeing (education, health, standard of living).13 We aim to contribute to a large and growing literature on the association between disability and multidimensional poverty (United Nations 2019b; Mitra et al 2022b).
A. Results
The entire set of results is available in the Multidimensional Results Tables ( 2022 results table ). Table 9.1 shows cross-country estimates of the headcount or the share of women in multidimensional poverty. Persons with functional difficulties have a higher share of adults in multidimensional poverty, with a gradient by level of difficulty. The headcount stands at 57%, 49%, and 44% for persons with at least a lot of difficulty, some difficulty and no difficulty and differences across groups are statistically significant. It is also higher for women who reside in rural areas, for middle-aged women, and for women who have difficulties in two domains: hearing and communication. This result is driven by disproportionately lower education attainment, sanitation and standard of living indicators.
Table 9.1: Cross-country estimates for multidimensional poverty headcount among women (%)
| Sample | No Difficulty | Some difficulty | At least a lot of difficulty | Any difficulty |
| All women | 43.7 | 48.8 | 56.8 | 50.0 |
| Rural | 59.7 | 66.6 | 72.2 | 65.9 |
| Urban | 28.7 | 32.6 | 40.4 | 32.1 |
| Age 18-29 | 43.0 | 43.3 | 51.3 | 42.2 |
| Age 30 to 49 | 50.9 | 56.4 | 51.5 | 50.7 |
| With seeing difficulties | – | – | – | 49.7 |
| With hearing difficulties | – | – | – | 57.3 |
| With walking difficulties | – | – | – | 52.2 |
| With cognitive difficulties | – | – | – | 52.7 |
| With selfcare difficulties | – | – | – | 53.3 |
| With communication difficulties | – | – | – | 63.8 |
Source: Authors’ calculations based on MICS6 data for 34 countries
Note: ‘-‘ refers to not applicable for ‘No difficulty’ and not available for ‘Some difficulty’ and ‘At least a lot of difficulty’ due to small sample sizes in many countries.
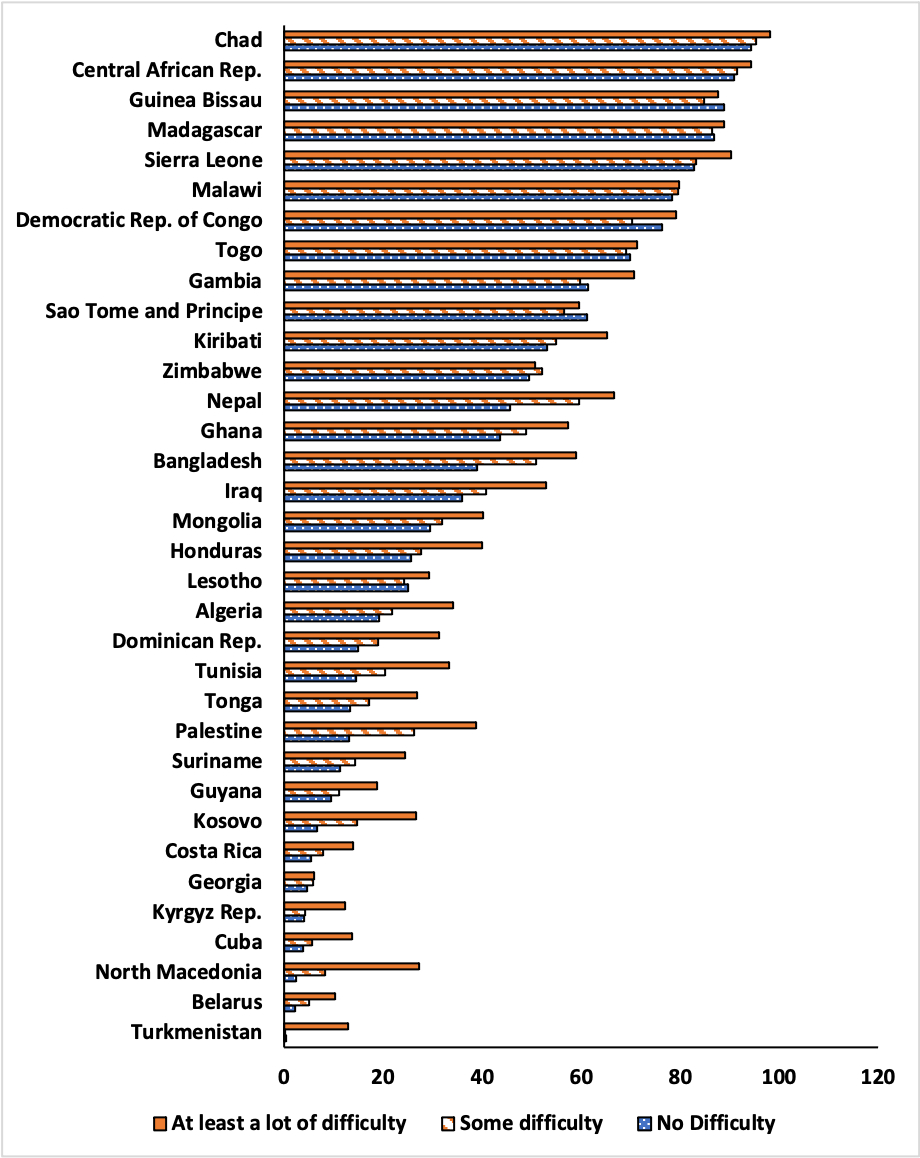
As shown in Figure 9.1, at the country level, the higher multidimensional poverty rate among persons with functional difficulties is also found for almost all countries14. The median disability gaps across countries stand at eight percentage points for at least a lot of difficulties and two percentage points for some difficulties. The gap tends to be larger in countries with higher levels of development, which is explored further in Box 2.
Figure 9.1: Multidimensional poverty headcounts among women (%)
Source: Authors’ calculations based on MICS6 data
| Box 2: Do disabilities inequalities grow with development?
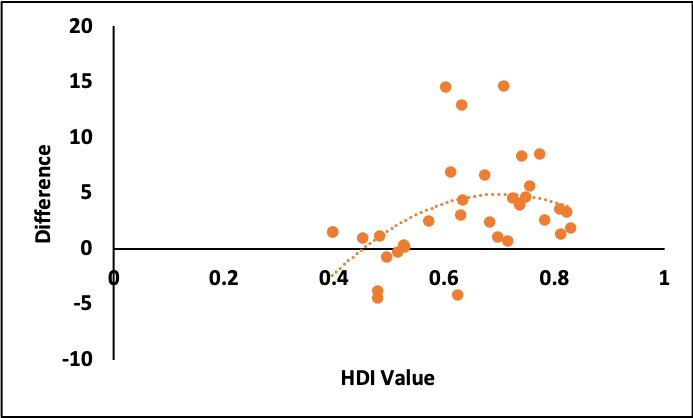
and development gap” to refer to the hypothesis that countries and communities may develop in such ways that persons with disabilities are left behind. For instance, in education, as secondary school becomes within the reach of a growing share of the population, practices and policies may not be inclusive and children with disabilities may not be able to access secondary schooling. Results for multiple countries in this Report and in the 2021 Report15 make it possible to consider if the disability gaps for various indicators are associated with higher levels of development. Our analysis partially supports the disability and development gap hypothesis: inequalities related to education, personal activities (employment, cell phone ownership), feeling discriminated against, subjective wellbeing, and multidimensional poverty are found to be significantly larger in countries at higher levels of development. However, no clear pattern emerges for standard of living indicators (e.g., adequate housing), perhaps due to adequate living conditions being achieved universally as countries develop. Figure 9.2 plots a measure of development, the Human Development Index (HDI), against the disability gap in the multidimensional poverty headcount for women in 34 countries using MICS6 data16 . HDI is a continuous variable that ranges between 0 and 1, with values closer to 1 reflecting higher levels of development (UNDP 2020a). It illustrates a positive correlation between disability gaps in the multidimensional poverty headcount and levels of human development.17,18 Figure 9.2: Human Development Index (HDI) and difference in multidimensional poverty headcount
Source: Authors’ calculations based on MICS6 data for 34 countries for the difference and UNDP (2020) for HDI Note: The difference in multidimensional poverty headcount is in percentage points. HDI is on a scale of 0 to 1. The higher the HDI value, the higher the level of human development. Further research is needed to understand the factors that contribute to this association for some indicators. Development may relate to inclusion patterns in different sectors (e.g., employment, education). It may also impact the prevalence of functional difficulties due to changes in healthcare access. Given the risk of a disability and development gap, there is an urgent need to adopt a disability-inclusive vision and practice of development for human development to be achieved for all. |
B. Discussion
Results suggest that persons with functional difficulties, on average, experience multiple deprivations at higher rates than persons without. The disability gaps found above are smaller than those in the 2021 Report, perhaps due to a lack of information on employment in the data and in the measure used in this Report. Indeed, the multidimensional poverty measure used above has two dimensions measured at the household level (health and standard of living) and only one measure at the individual level (education). This is likely to underestimate the level of deprivations at the individual level as we have no information on how resources are distributed within the household. Further research is needed with multidimensional poverty measures based on individual level indicators or with more of a balance between household and individual level indicators.
This Report adds to a growing literature that has considered the association between disability and the experience of multiple deprivations such as low educational attainment, non-employment, social isolation, poor psychological well-being, recently reviewed in United Nations (2019b). This result suggests that multidimensional poverty indicators should be disaggregated by disability status and that persons with disabilities should be explicitly incorporated in policymaking and research agendas related to poverty
13 Details on the indicators and thresholds are described in Appendix 3 Method brief #3.
14 Exceptions are São Tomé & Principe and Guinea-Bissau.
15 An analysis of the 2021 Report results in light of the disability and development gap hypothesis is in Lewis et al 2022.
16 HDI was not available for Kosovo.
17 The result holds when using Gross National Income (GNI) per capita as development measure. A similar pattern is also found if we consider inequalities in relative terms with the ratio in the multidimensional poverty headcount for women with functional difficulties relative the headcount for women without functional difficulties.
18 A similar result was reached by Lewis et al (2022) for education and employment, and multidimensional poverty outcomes using differences across functional difficulty status from the 2021 Report.
 Go Back
