Prevalence of Functional Difficulties
This section describes and discusses the main results on prevalence. Information on the methodology is in Appendix 3 Method brief #4. The entire set of results on prevalence in available in the Prevalence Results Tables.
Main Results
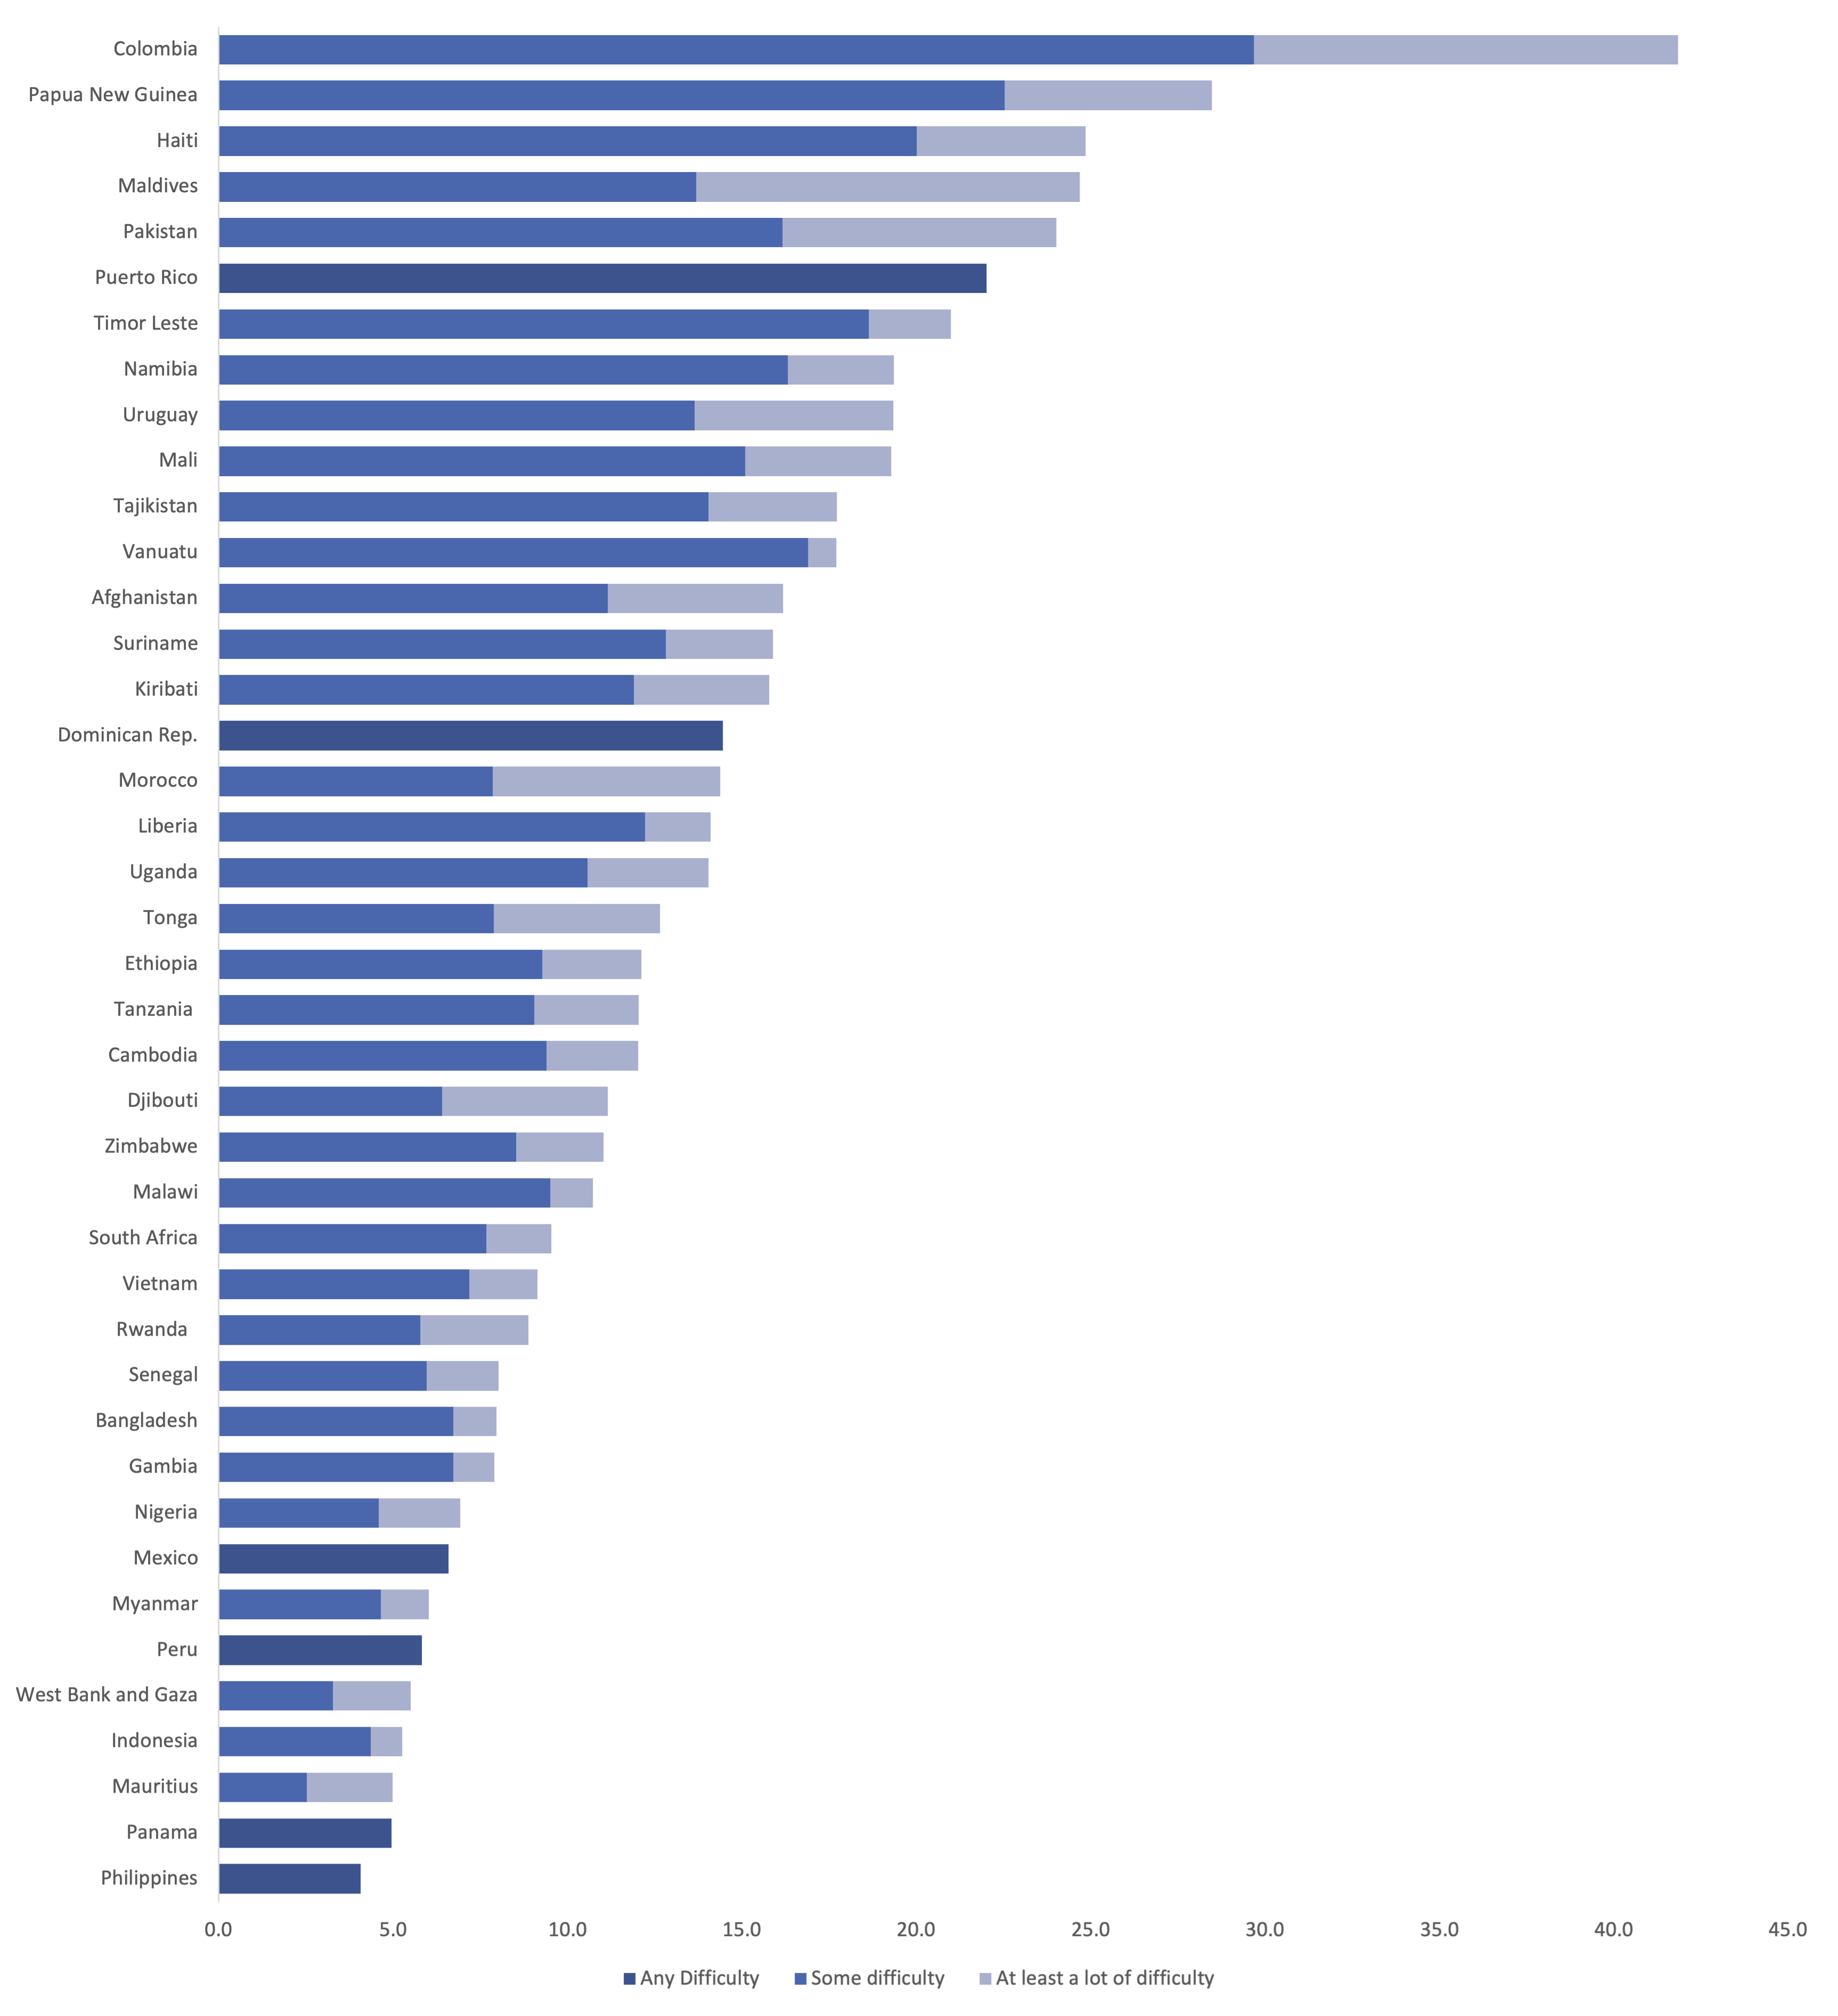
The median prevalence of functional difficulties for adults aged 15 and older among the 41 countries stands at 12.6%. As shown in Figure 5.1, it ranges from a low of 4.1% in the Philippines to a high of 48.1% in Colombia. Only two countries have prevalence rates below 5% (Philippines, Panama) and seven countries have prevalence rates above 20% (Timor Leste, Puerto Rico, Pakistan, Maldives, Haiti, Papua New Guinea, Colombia).
In the countries with a graded answer scale, having ‘some difficulty’ is more common than having ‘at least a lot of difficulty’. The median prevalence of ‘some difficulty’ and ‘at least a lot of difficulty’ stand at 9.4% and 2.5% respectively. Figure 5.1 below gives the prevalence rate of ‘any functional difficulty’ at the individual level from the lowest to the highest with a breakdown for ‘some difficulty’ and ‘at least a lot of difficulty’ for countries with a graded answer scale.
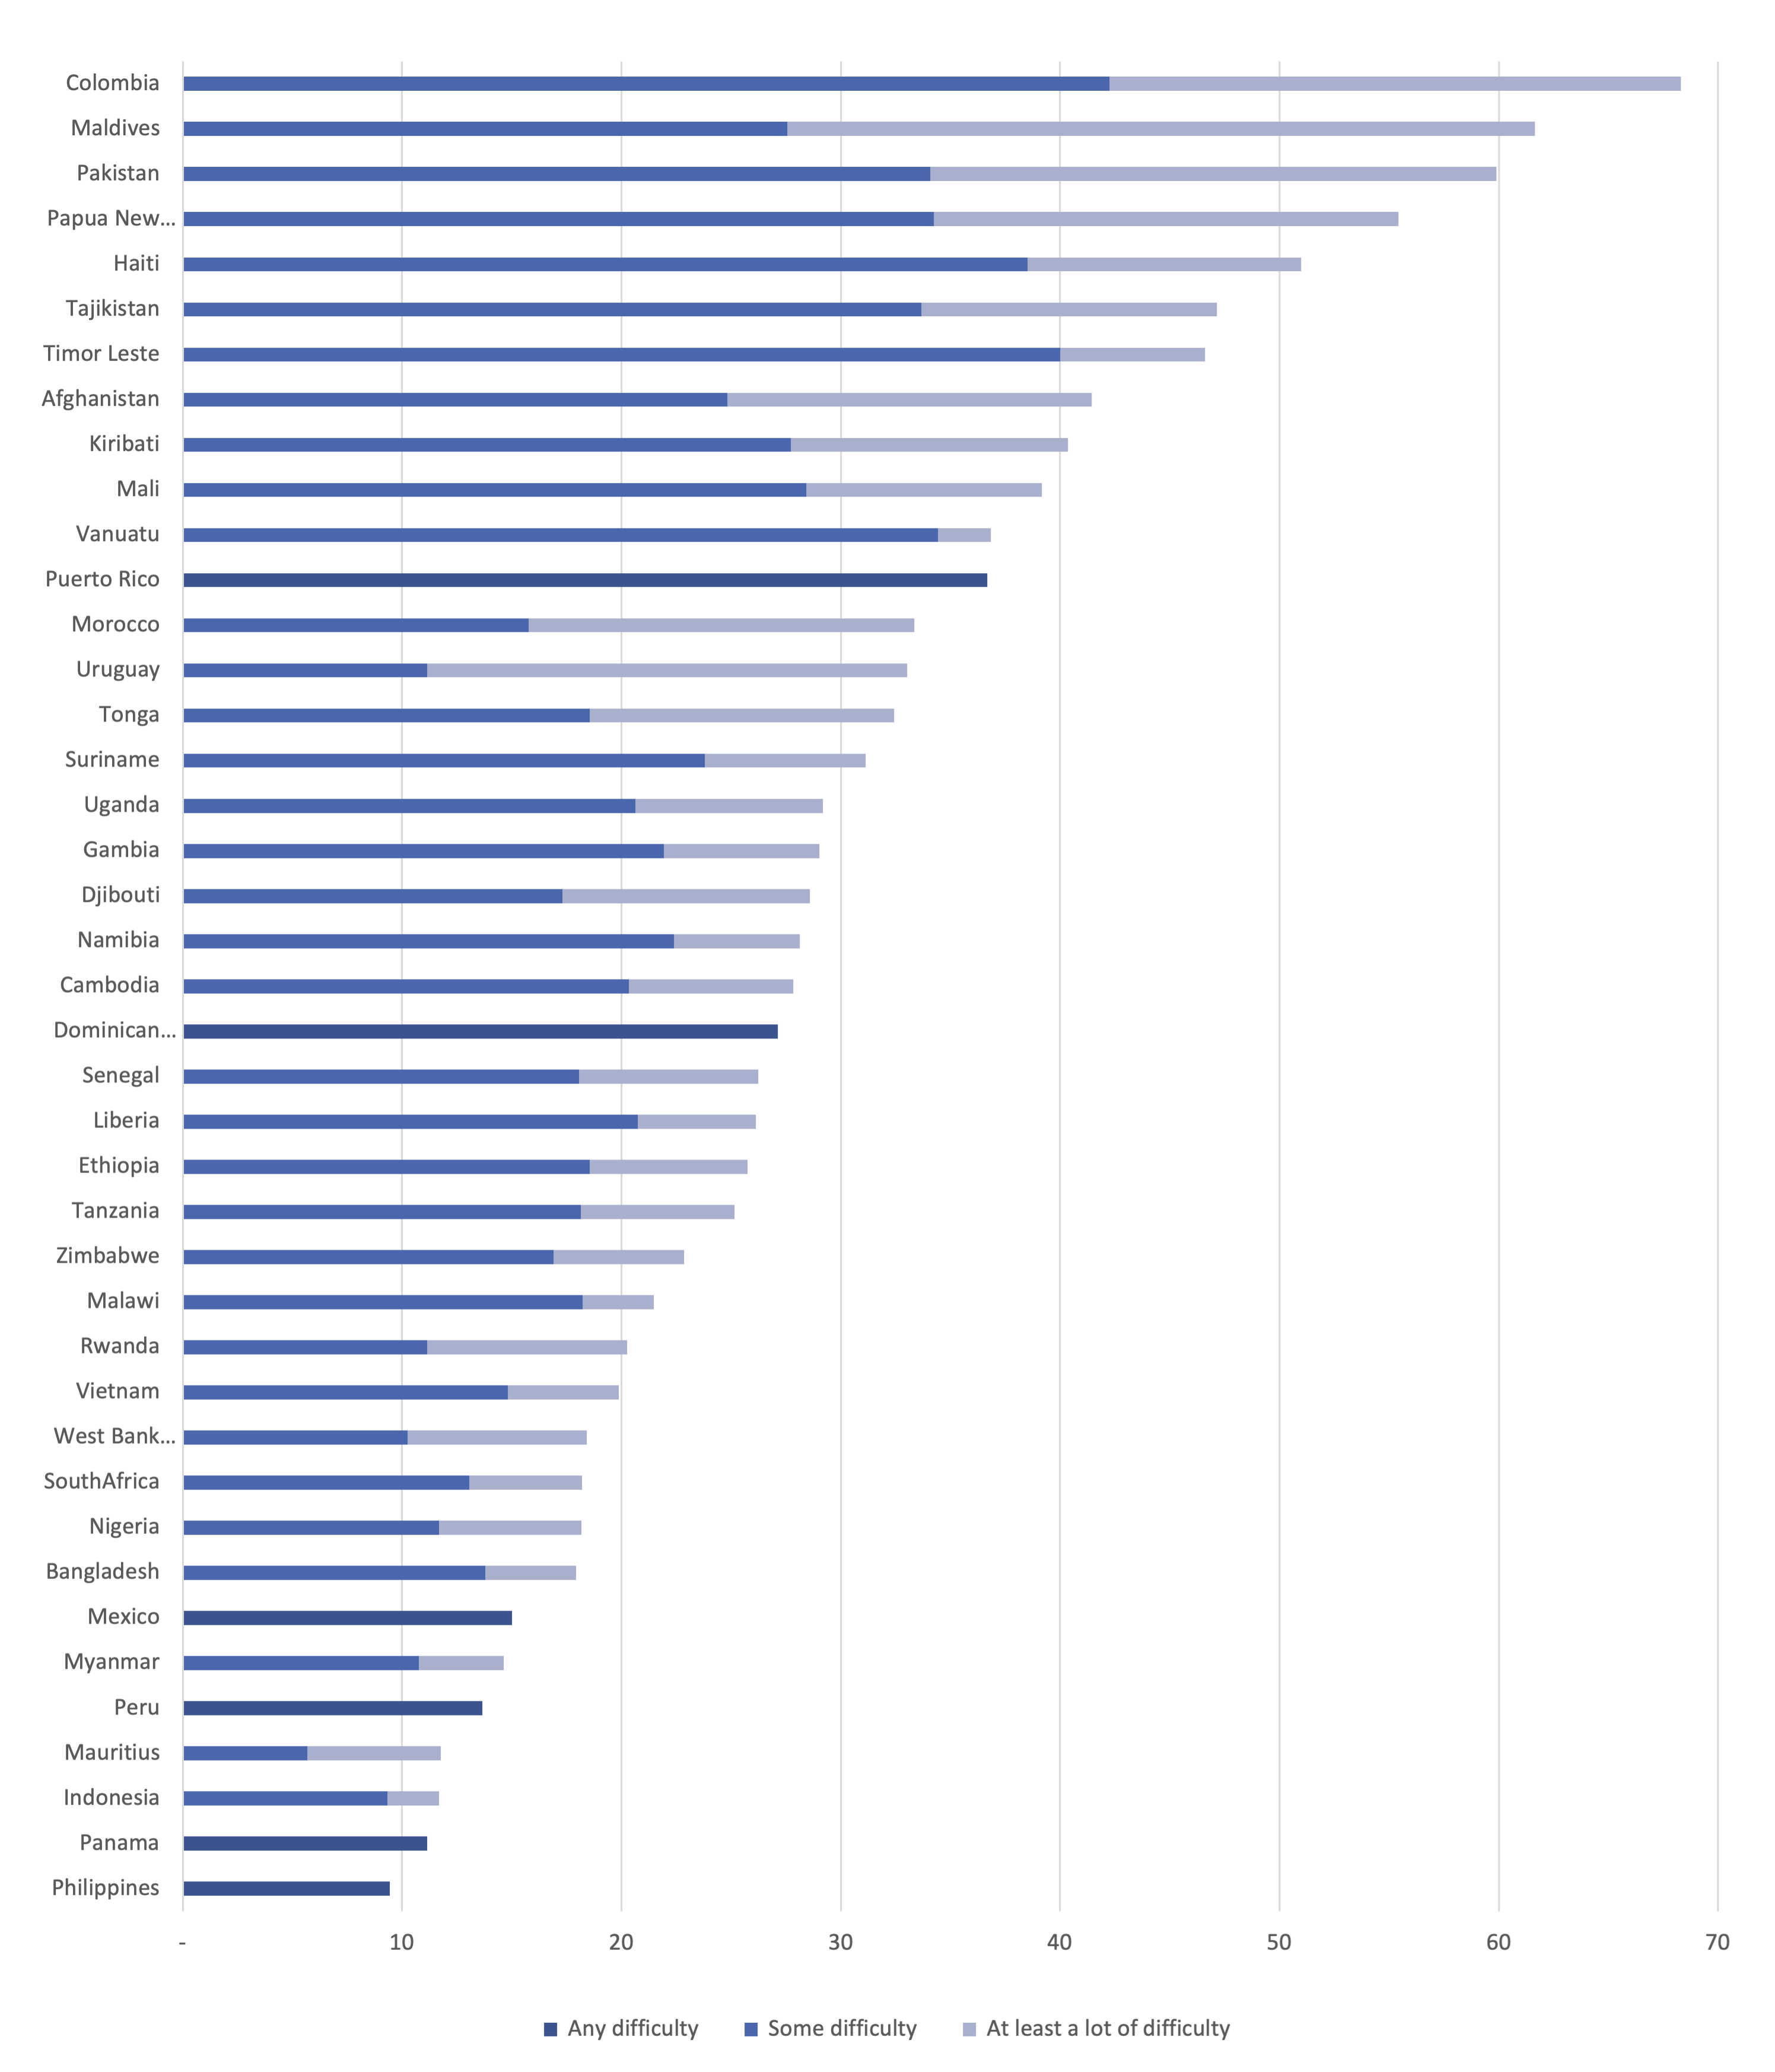
The prevalence of functional difficulties is higher at the household level than at the individual level in all countries. As shown in Figure 5.2, the household level prevalence ranges from a minimum of 9.4% in the Philippines to a maximum of 68.3% in Colombia. The median household level prevalence stands at 27.8%, i.e. more than one in four households has a functional difficulty.
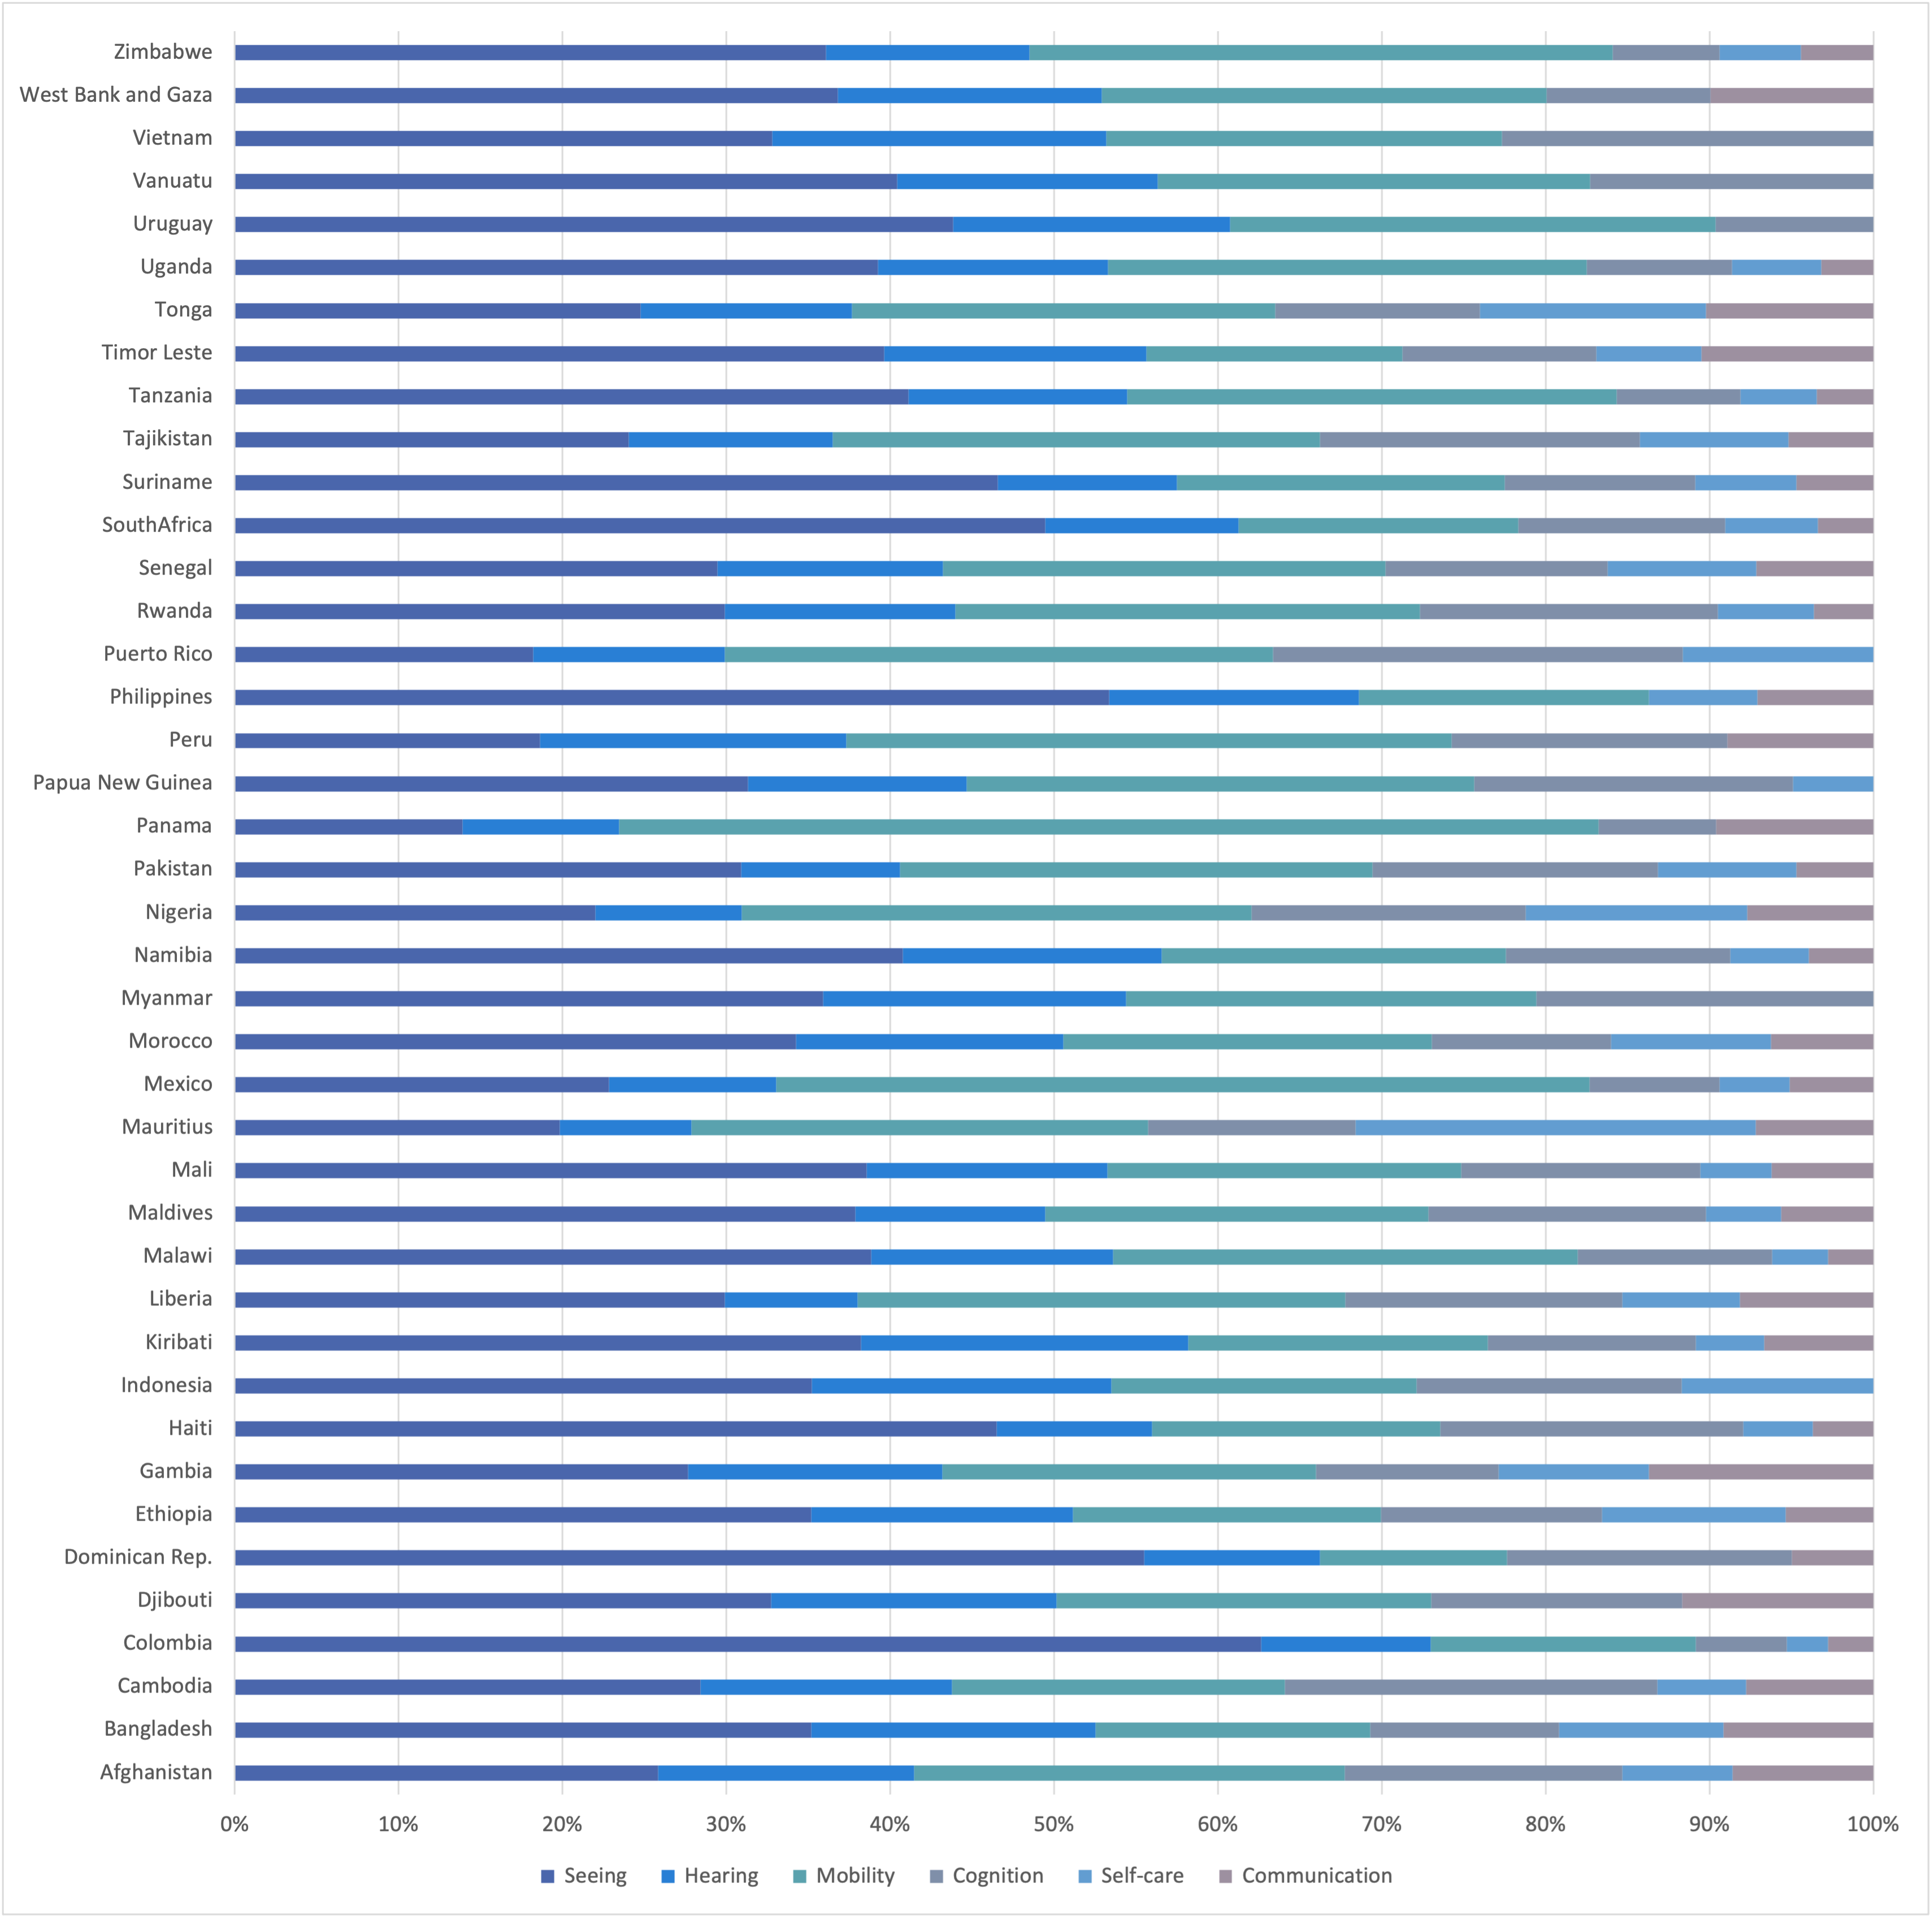
Functional difficulties tend to be more common in rural areas, affect older age groups more than younger ones, as well as women more than men. In most countries, seeing and walking difficulties are more prevalent than hearing, cognition, self-care or communication difficulties as shown in Figure 5.3.
Figure 5.1: Prevalence Of Functional Difficulties Among Adults Age 15+ (%)
Source: Own calculations based on datasets in Table 4.1
Figure 5.2: Share Of Households With Functional Difficulties
Source: Own calculations based on datasets in Table 4.1
Figure 5.3: Types Of Functional Difficulties Among Adults With Any Difficulty (%)
Notes: Although the Philippines Census questionnaire had a question on cognitive difficulty, there was no information on this in the datafile. For Indonesia, communication and cognition domains are together under cognition.
Discussion
Overall, functional difficulties affect sizeable proportions of individuals and households. Based on national data for 41 countries, this study estimates that disability is highly prevalent among adults and their households. Only two countries have prevalence rates below 5% among adults 15 and older and the median prevalence of any functional difficulty among adults in the 41 countries stands at 12.6%.
This result is overall in line with estimates of global prevalence among adults of the last decade that use different datasets, survey questions and methodology[9] (WHO-World Bank 2011, Mitra and Sambamoorthi 2014).
Functional difficulties tend to be more common among women than men, in rural areas compared to urban areas, as well as among older individuals. More research is needed on such patterns, notably on the higher prevalence found among women in this report and in other studies (WHO-World Bank 2011; Mitra and Sambamoorthi 2014).
The national prevalence estimates in this paper may offer a lower estimate of prevalence given that only four to six functional difficulties are measured. More data collection efforts are needed for instance using the Washington Group Enhanced short set or Extended set of questions to capture psychosocial and mental health-related functional difficulties.
In this study’s findings, there is considerable variation in the prevalence of functional difficulties across the 41 countries. Variation could be due to various factors including differences in the underlying age and sex population structures, environmental barriers, access to assistive devices and healthcare, but also differences in survey questions, translations and survey staff training. Although the disability questions used in this report are deemed internationally comparable, there are still some differences in the questions used that could drive the differences in prevalence estimates across countries. First, there are differences between the 21 countries with the WGSS, on the one hand, and the 20 countries with other functional difficulty questions, on the other. There is more variability in prevalence estimates among the countries with other functional difficulty questions (min: 4.1%, max: 41.8%, sd=9.6) compared to the countries with the WGSS (min: 6.9%, max: 24.9%; sd=5.8)[10]. This is to be expected as countries with other functional difficulty questions used varied wording in questions and answers[11] and sometimes do not have the self-care and communication domains. In addition, even among countries with the WGSS, there may be differences in the way the questions are implemented (e.g. placement and labeling within a questionnaire, training of census/survey workers on how to administer the questions) or environmental factors (e.g. awareness and potential stigma around functional difficulties) that could also influence how the questions are perceived and prevalence estimates.
In addition, while the WGSS or other functional difficulty questions can be used to estimate prevalence, they do not show in and of themselves if and how some functional difficulties might be avoidable. Functional difficulties may be preventable, at least in part. There is evidence that, at least in some LMICs, only a minority of persons with at least a lot of difficulties use assistive devices (e.g. glasses, hearing aids, wheelchairs) (e.g. Eide and Mmatli 2016, Mitra 2018). This could be due to a variety of reasons including the lack of availability of assistive devices or services, or their lack of affordability. More broadly, rehabilitation needs are large and are rarely fulfilled in LMICs, and poverty may prevent individuals from taking measures to reduce their functional difficulties.
The extent to which some of the functional difficulties might be preventable through policies that address environmental barriers to healthcare or in the community, assistive devices, and underlying health conditions needs attention.
Most of the countries under study are LMICs. The sizeable prevalence found in LMICs is consistent with the World Report on Disability (p. 30) but stands in contrast to results in earlier studies that had typically shown higher disability prevalence in high income countries (HIC) compared to LMICs (e.g. Helander 1999). This result of earlier studies is due, at least in part, to the fact that LMICs used to primarily use impairment questions which are not internationally comparable and lead to low prevalence estimates. This report uses functional difficulty questions that are deemed internationally comparable. The sizeable prevalence found in LMICs in this study using functional difficulty questions suggests that disability is an important international development issue and that there is a need for further research on the factors related to development that may have an impact on prevalence and inclusion.
[9] Using the 2002-2004 World Health Survey (WHS) for 59 countries and with a score that aggregates answers to 15 questions in the WHS on difficulties experienced in eight domains (vision, mobility, cognition, self-care, pain, interpersonal relationships, sleep and energy, affect), WHO-World Bank (2011) estimated a global prevalence of 15% among adults. Still using the WHS, but this time for 54 countries and only four questions and domains (seeing, concentrating, moving around, self-care), Mitra and Sambamoorthi (2014) find a prevalence of 14% for all adults. As part of the Global Burden of Disease (GBD) study (Murray and Lopez 1996), disability prevalence is regularly estimated: it is inferred from data on health conditions and impairments alone using assumptions on distributions of limitations that may result from health conditions and impairments that last six months or more. For instance, the 2004 GBD study (WHO 2008) suggests that globally, among adults over the age of 15, 19.4% have a severe or moderate disability and 3.8% have a severe disability.
[10] These minima, maxima and standard deviations are for individual level prevalence rates.
[11] It is perhaps not surprising that Colombia and Papua New Guinea have the highest prevalence rates as their answer scale is the reserve of the WGSS as follows: 1. Cannot do at all; 2. A lot of difficulty; 3. Some difficulty; 4. No difficulty.
 Go Back

