Standard of Living
This section describes and discusses the main results using five indicators related to the standard of living of women’s households by functional difficulty status. They inform CRPD Article 28 on “Adequate standard of living and social protection” and include the share of women in households with electricity (SDG 7.1.1); using clean fuel for cooking (SDG 7.1.2); with adequate housing; who own assets; who own a cell phone (SDG 5.b.1).
A. Results
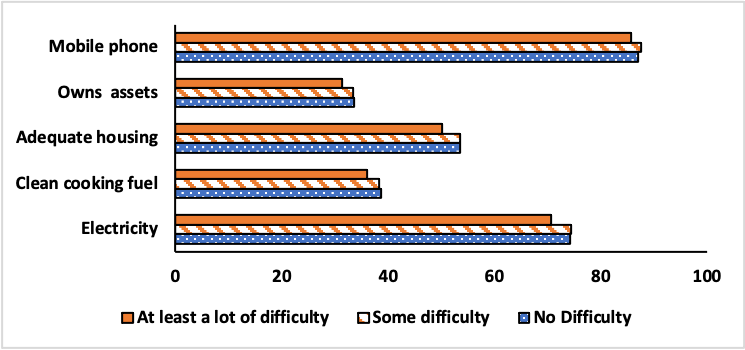
The entire set of results is available in the Standard of Living Results Tables (2022 results table ). At the country level, results are somewhat mixed with gaps in standard of living indicators found only for some countries. Figure 8.1 presents the cross-country estimates for the five indicators. Differences across functional difficulty status are small (under five percentage points). Women with at least a lot of difficulty are significantly worse off than women with no difficulty with respect to electricity, cooking fuel, adequate housing, and asset ownership. There is no significant difference between women with some difficulty and no difficulty in the cross-country estimates for all five indicators.
Figure 8.1: Cross-country estimates for standard of living indicators for women (%)
Source: Authors’ calculations based on MICS6 data for 34 countries.
Note: These indicators stand for the share of women who live in households with specific living conditions or assets
Table 8.1 presents the cross-country estimates for owning assets for different subgroups. Across functional domains, women with selfcare and communication difficulties have the lowest rates of asset ownership.
Table 8.1: Cross-country estimates for asset ownership among women (%)
| Sample | No Difficulty | Some difficulty | At least a lot of difficulty | Any difficulty |
|---|---|---|---|---|
| All women | 33.6 | 33.5 | 31.3 | 33.2 |
| Rural | 25.3 | 24.7 | 23.3 | 25.3 |
| Urban | 40.6 | 40.8 | 39.1 | 42.0 |
| Age 18 to 29 | 31.1 | 31.2 | 29.4 | 32.1 |
| Age 30 to 49 | 32.5 | 32.1 | 30.3 | 33.4 |
| With seeing difficulties | – | – | – | 33.7 |
| With hearing difficulties | – | – | – | 30.6 |
| With walking difficulties | – | – | – | 32.9 |
| With cognitive difficulties | – | – | – | 32.3 |
| With selfcare difficulties | – | – | – | 30.1 |
| With communication difficulties | – | – | – | 30.1 |
Source: Authors’ calculations based on MICS6 data for 34 countries.
Note: ‘-‘ refers to not applicable for ‘No difficulty’ and not available for ‘Some difficulty’ and ‘At least a lot of difficulty’ due to small sample sizes in many countries. This indicator is the share of women who live in households with specific assets
B. Discussion
Most of the countries under study in this report are in Low- and Middle-Income Countries (LMICs) where income is volatile as many workers are in the informal sector and poverty is often measured through assets and living conditions. Our results suggest that in terms of assets and living conditions, there are some differences across functional difficulty status. However, they tend to be small (under five percentage points) and mostly affect women with a lot of difficulties.
Compared to the 2021 Report, the differences across functional difficulty status are less consistent across countries. This is due in part to the composition of our sample countries wherein we have countries with higher levels of development that have achieved adequate living conditions universally. For instance, the share of women in households with electricity is above 99% for all women, irrespective of their functional difficulty status in Costa Rica, Cuba, Dominican Rep. and the Kyrgyz republic, among others.
 Go Back