Education
This report uses several indicators on education outcomes for women aged 18 to 49. First is the share of women who have ever attended school. Next, the highest level of educational attainment achieved is measured through the following: shares of women with 1) less than primary school completion, 2) primary school completion, and 3) secondary school completion or higher. Finally, literacy rate is defined as the share of women with the ability to read a short simple statement about everyday life or who attended secondary or higher education (SDG indicator 4.6.1).
A. Results
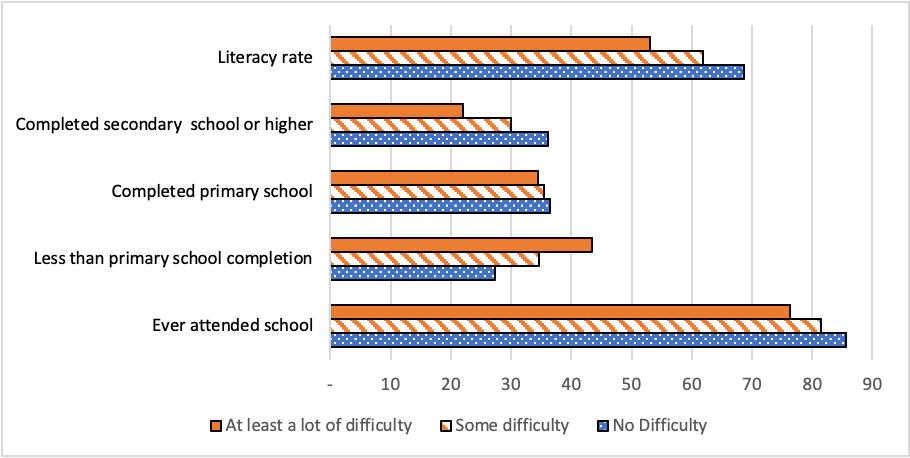
The entire set of results on education is available in the Education Results Tables (2022 results table). In most countries and in cross-country estimates,10 women with functional difficulties tend to be worse off in terms of education outcomes compared with women without functional difficulties. Cross-country estimates are shown in Figure 5.1 for all education indicators. For example, the share of women with less than primary school stands at 27%, 35% and 44% for women with no difficulty, some difficulty, and at least a lot of difficulty respectively. In addition, in cross-country estimates and in many individual country-level estimates, there is a gradient in the disability gap for outcomes, i.e. persons with some difficulties are worse off than persons with no difficulty, but better off than persons with at least a lot of difficulty. Compared to middle-aged women (age 30 to 44), younger women (age 18 to 29) tend to have higher levels of educational attainment, captured in the lower share of women with less than primary school completion.
Figure 5.1: Cross-country estimates for education indicators among women (%)
Source: Authors’ calculations based on MICS6 data for 34 countries
Table 5.1 contains the cross-country estimates for the less than primary school completion indicator. Women who live in rural areas as well as those who are middle-aged are less likely to have completed primary school compared to their urban and younger counterparts. Among women with functional difficulties, those with self-care and communication difficulties are less likely to have completed primary school.
Table 5.1: Women with less than primary school completion (%)
| Sample | No Difficulty | Some Difficulty | At least a lot of difficulty | Any Difficulty |
|---|---|---|---|---|
| All women | 27.4 | 34.6 | 43.5 | 35.9 |
| Rural | 37.5 | 47.8 | 55.4 | 48.9 |
| Urban | 17.8 | 22.1 | 30.2 | 23.3 |
| Age 18 to 29 | 20.3 | 21.6 | 29.7 | 22.5 |
| Age 30 to 49 | 35.8 | 39.1 | 45.7 | 40.2 |
| With seeing difficulties | – | – | – | 36.2 |
| With hearing difficulties | – | – | – | 42.4 |
| With walking difficulties | – | – | – | 39.2 |
| With cognitive difficulties | – | – | – | 38.0 |
| With selfcare difficulties | – | – | – | 44.9 |
| With communication difficulties | – | – | – | 45.5 |
Source: Authors’ calculations based on MICS6 data for 34 countries
Note: ‘-‘ refers to not applicable for ‘No difficulty’ and not available for ‘Some difficulty’ and ‘At least a lot of difficulty’ due to small sample sizes in many countries
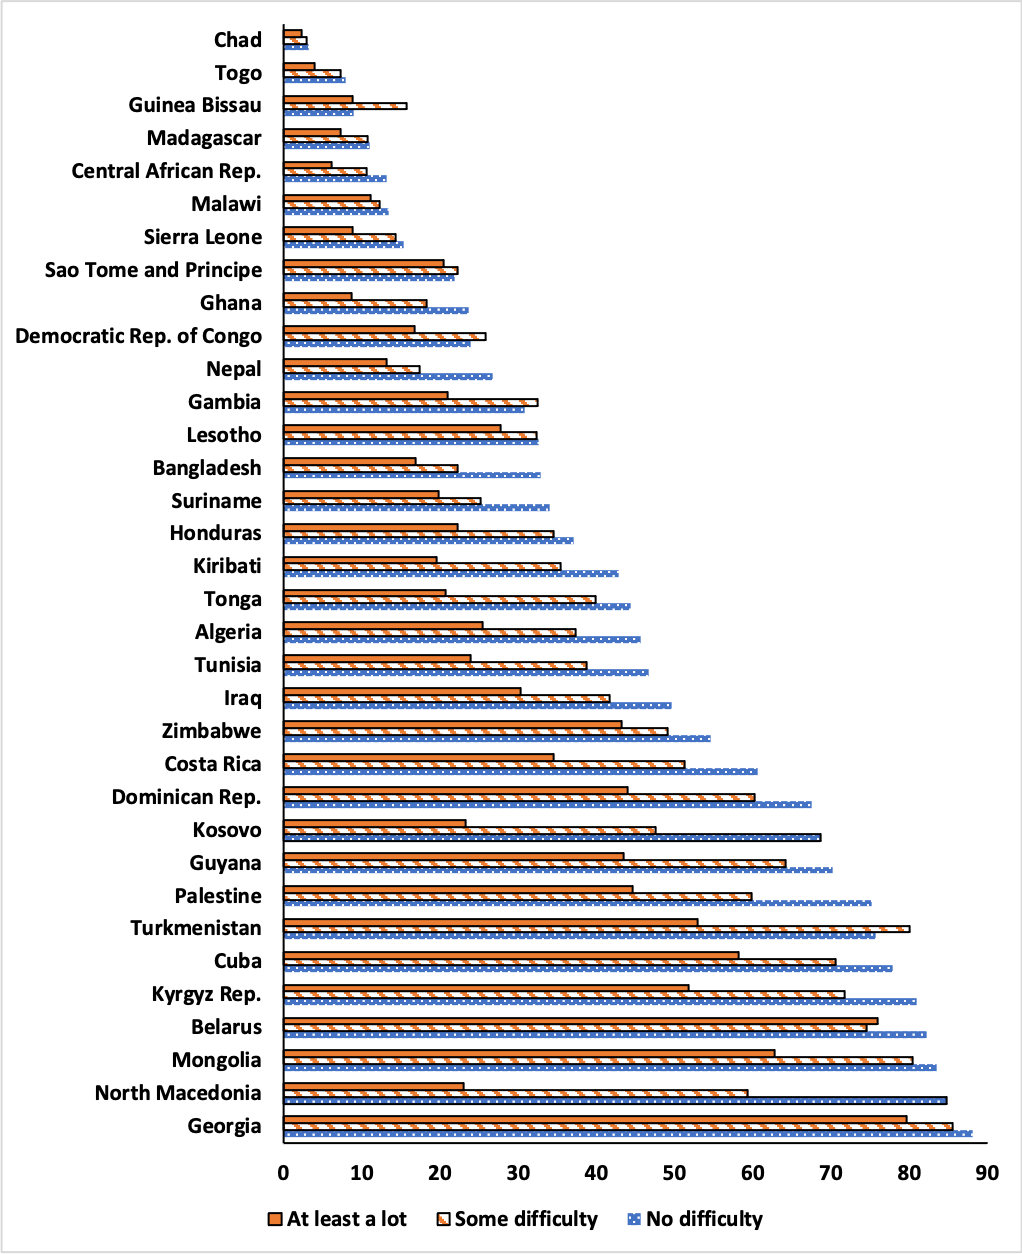
Figure 5.2 presents the share of women who have completed secondary school or higher at the country level. It is significantly lower for women with at least a lot of difficulty in 28 out of 35 countries. The disability gap between women with at least a lot of difficulty and no difficulty is widest at 31 percentage points (p.p.) in North Macedonia where 54% of persons with any difficulty have completed secondary school or higher compared to 85% for persons with no difficulty.
Relatedly, we find a larger disability gap for the share of women who have completed secondary school or higher among younger women aged 18 to 29 compared to middle-aged women age 30 to 44 in several countries (DRC, Gambia, Ghana, Iraq, Kiribati, Mongolia, Palestine, Tunisia) (Tables E4.4 and E4.5 in Education Results Tables https://www.disabilitydatainitiative.org/2022-results-table/). This may be due to progress in education outcomes over time with universalization efforts for primary and secondary education that may be less effective for children with disabilities.
Figure 5.2: Women who have completed secondary school or higher (%)

Source: Authors’ calculations based on MICS6 data
B. Discussion
This Report finds that gaps in education outcomes for women are found in most of the sample countries. Overall, results are consistent with the findings in the 2021 Report and in earlier literature (United Nations 2019b, pp.81-83) that women with functional difficulties tend to have lower educational attainment and literacy rates.
The disability gaps in education found in this report could be due to several factors. For instance, extreme hunger and poverty may make it difficult for children to stay in school and the lack of adequate nutrition and exposure to poverty may also lead to functional difficulties. Having lower education and poorer literacy skills may limit women’s working options to occupations with harsh working conditions that may contribute to the onset of functional difficulties.
In addition, having a functional difficulty as a child or adolescent may make attending school challenging, notably due to environmental barriers in the community and in schools, a lack of teacher training or a lack of resources preventing access to medical services or goods (e.g., glasses) which can impede learning. Using MICS6 data on child functioning, UNICEF (2021b) shows that children with functional difficulties are more likely to be out of school than children with no difficulty and that out-of-school rates increase during secondary school.
[10] Cross-country estimate is calculated using the weighted average of countries where the indicator is available.
 Go Back